
Shahab uddin
Transforming raw data into actionable insights
Data Analyst | Power BI Developer | Excel Specialist | Reporting analyst
Transforming raw data into actionable insights
Data Analyst | Power BI Developer | Excel Specialist | Reporting analyst

I'm a data analyst Proficiency in using advanced programming languages including DAX and SQL to extract actionable insights from complex datasets demonstrates expertise , data visualization, and predictive modeling. I've helped organizations make data-driven decisions that have led to significant improvements in business performance.
SQL
Power BI, Excel,DAX,Data modeling.
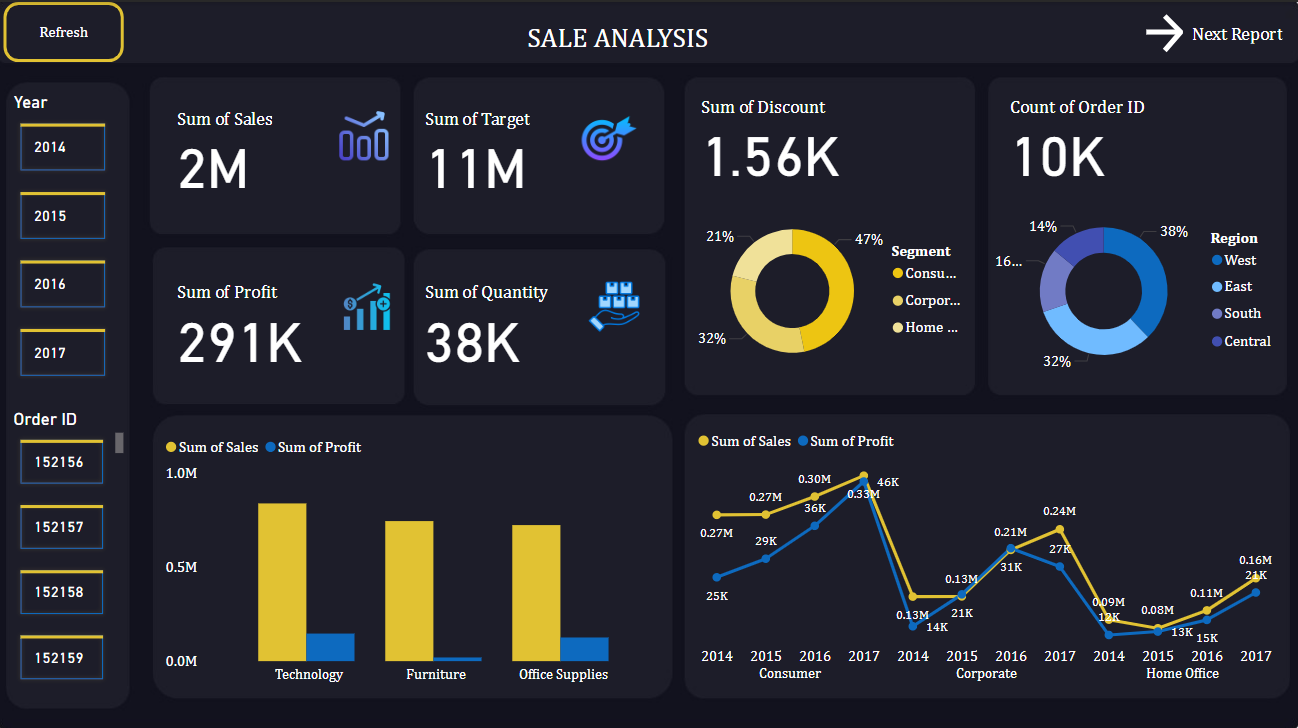
This sales dashboard offers a quick view of key metrics like total sales, profit, discounts, quantity sold, and order count. It includes pie charts for discount and order distribution, bar charts for sales trends, and filters for year and order ID to refine insights.
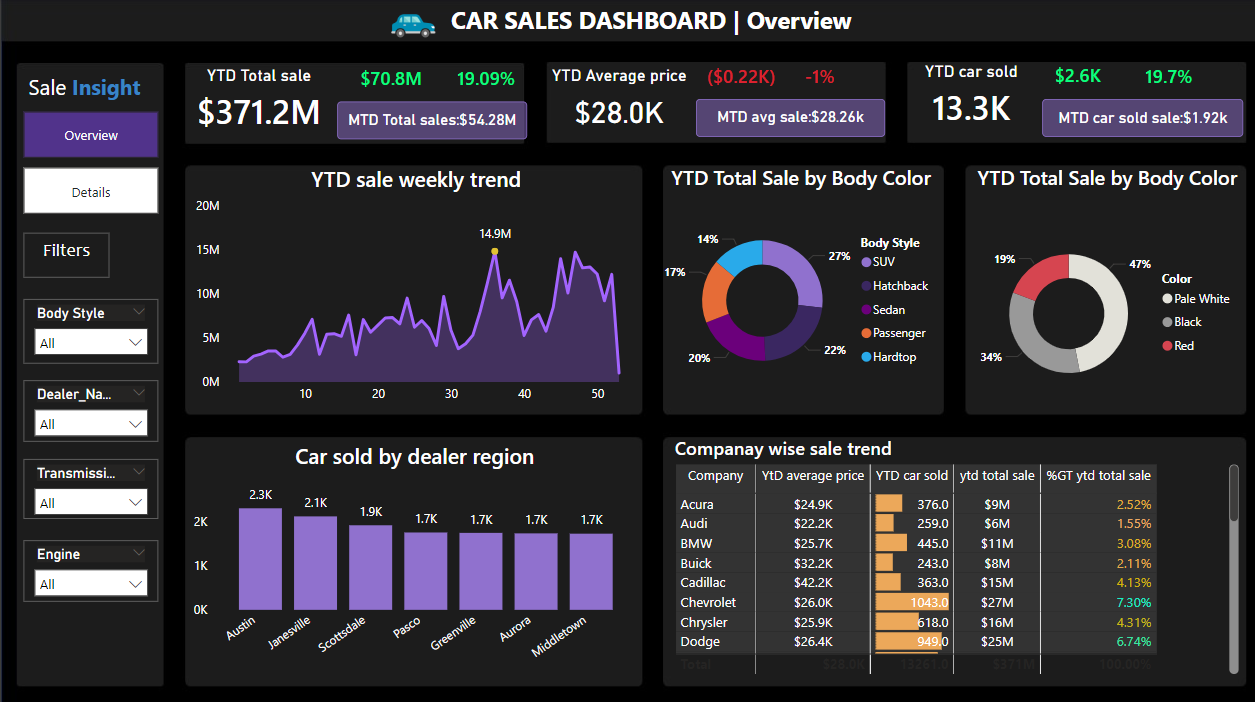
This interactive Car Sales Dashboard provides key insights into Year-to-Date (YTD) performance, tracking total sales of $371.2M with 13.3K cars sold (+19.7%) and an average price of $28K (-1%). The dashboard visualizes sales trends, dealer performance, body style preferences, and company-wise sales distribution.
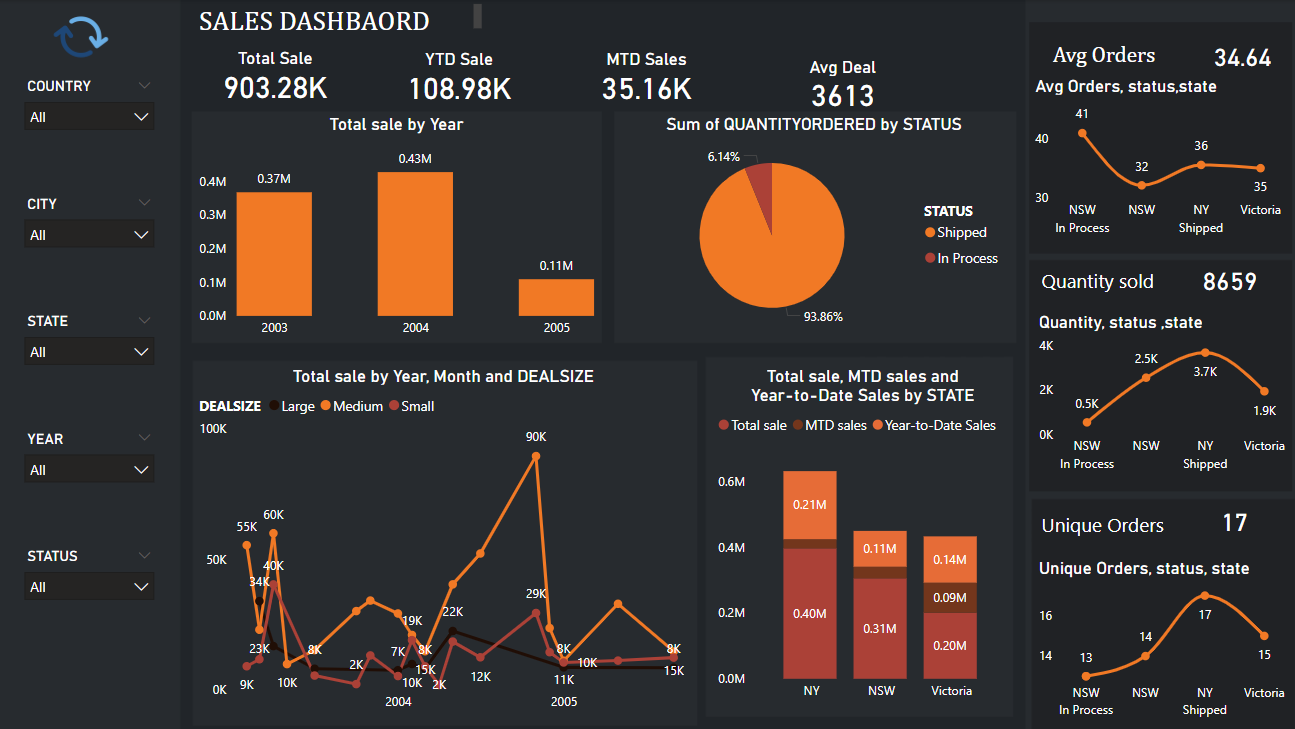
This dashboard helps in tracking sales performance, trends by state & year, and analyzing order & deal sizes for data-driven decisions. 🚀
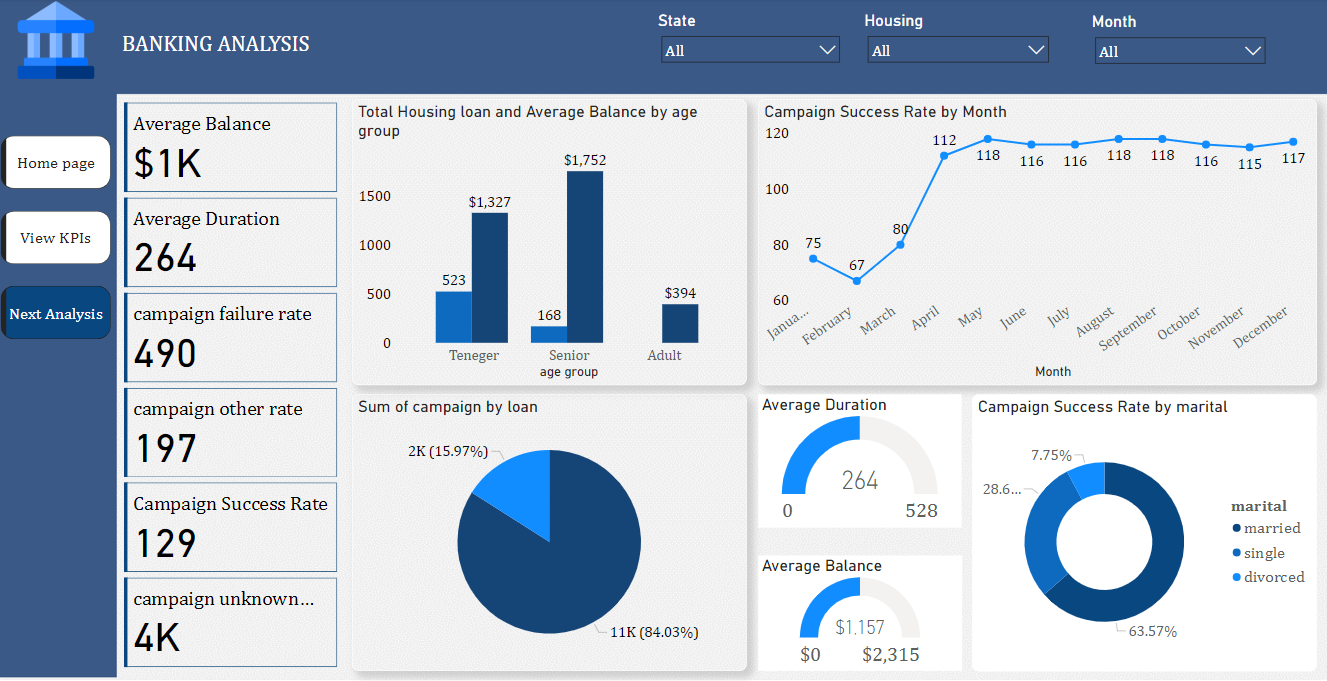
This dashboard clarifies complex banking data and serves as a decision-making tool for understanding customer behavior, marketing performance, and loan insights. Key Features & Insights.
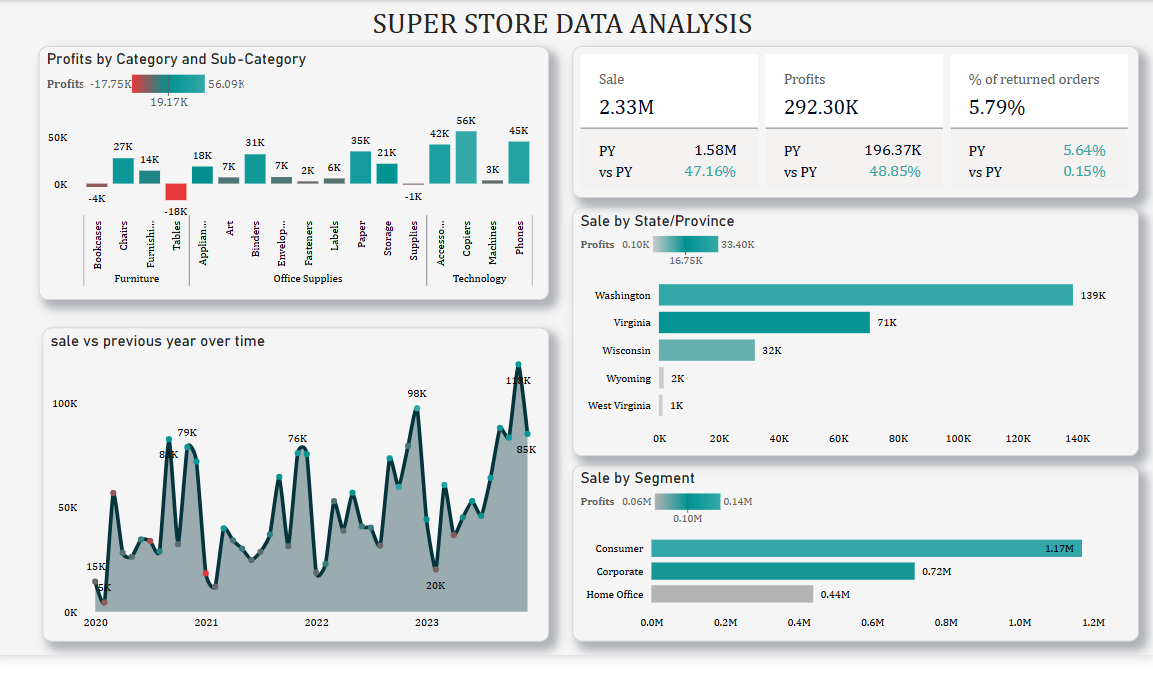
This project offers a detailed analysis of a superstore's performance metrics through interactive dashboards. It provides insights into profits by category, sales trends over time, regional sales, and customer segments. Key performance indicators highlighted include total sales, total profits, and return rates, along with year-over-year comparisons.
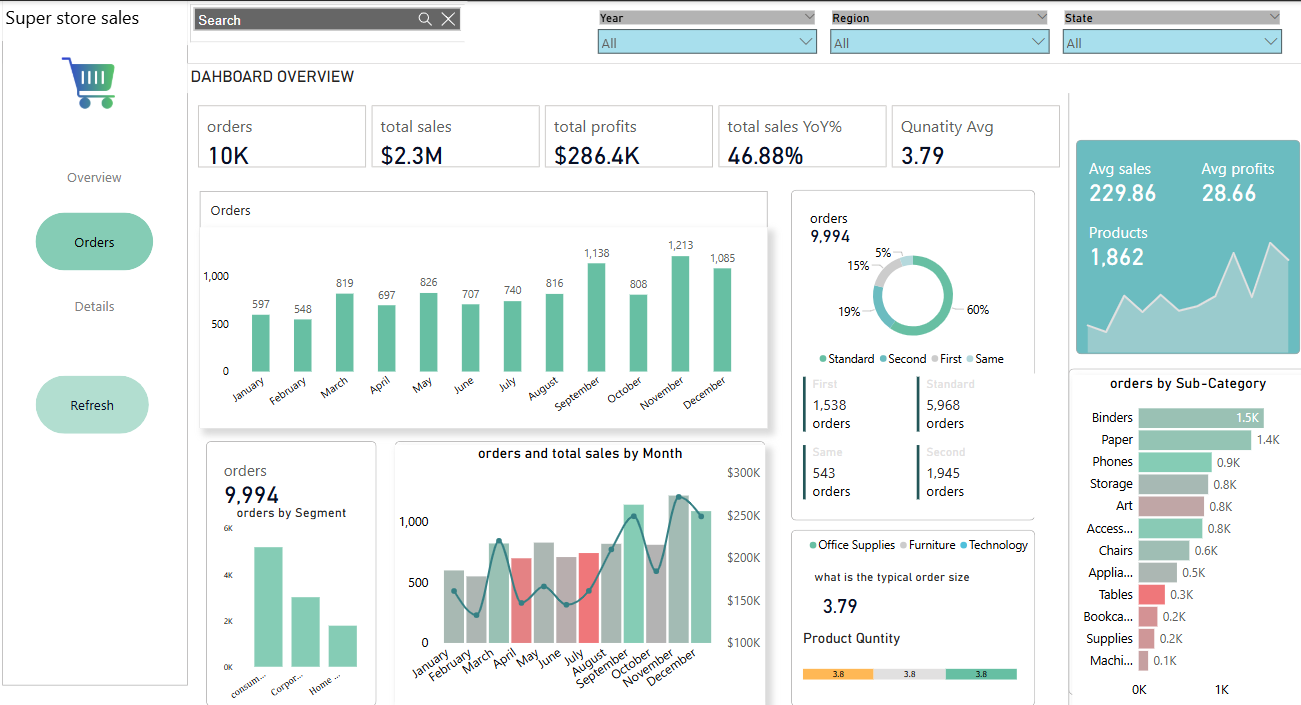
I developed interactive superstore dashboards to visualize key metrics The dashboard shows that total orders are 10,000 with sales of $2.3M and profits of $286.4K. The Consumer segment leads in orders, December has the highest order count, and standard orders are most common. Average sales and profits are $229.86 and $28.66, respectively, with Binders being the most popular sub-category. Key insights highlight peak orders in December and the Consumer segment's strong performance..
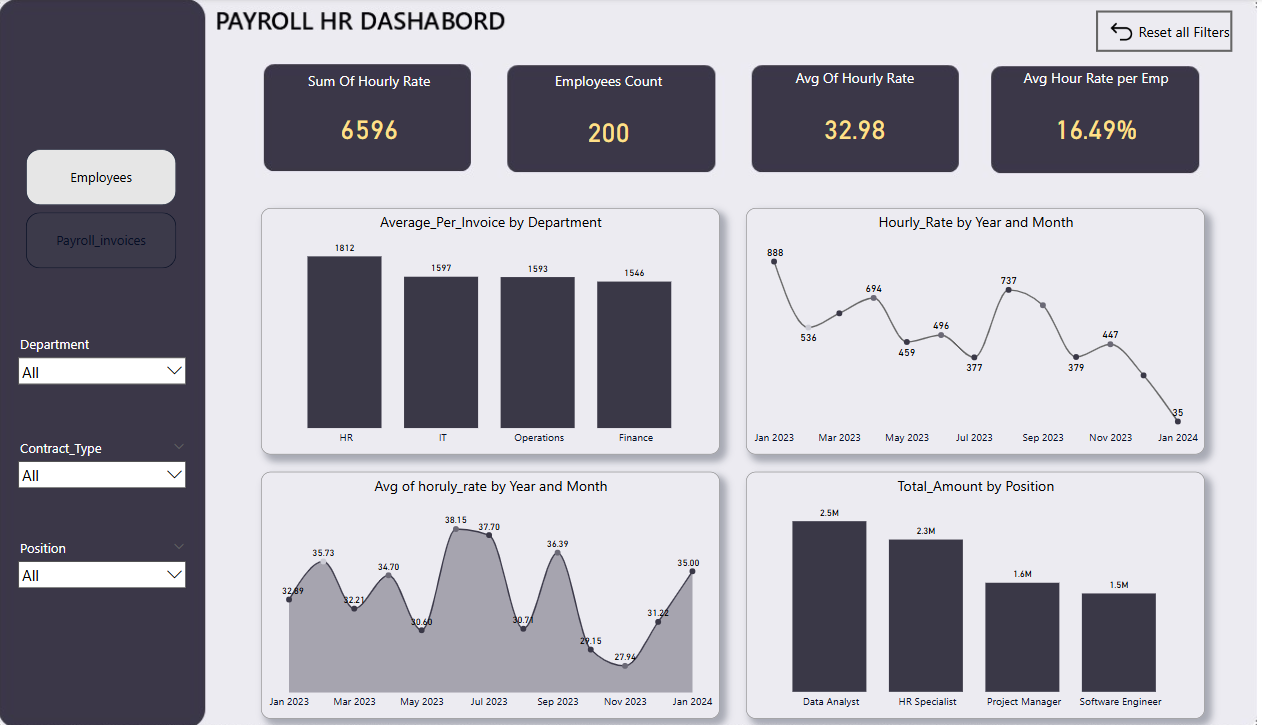
This Payroll & HR dashboard summarizes key metrics—including employee data filters, hourly rate trends average 32.9.
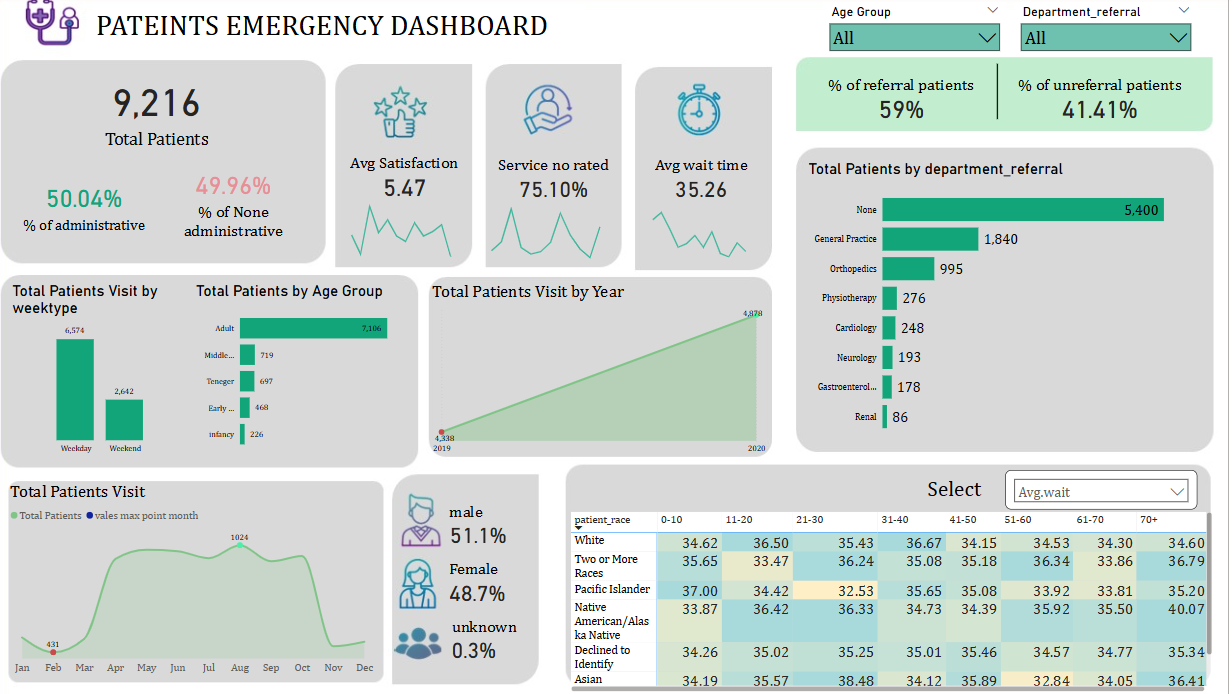
Transforming Healthcare with Data Insights Every patient visit tells a story, and data helps us listen. Using Power BI, this Patients Emergency Dashboard uncovers trends in wait times, satisfaction levels, and patient demographics—enabling hospitals to make informed decisions for better care.
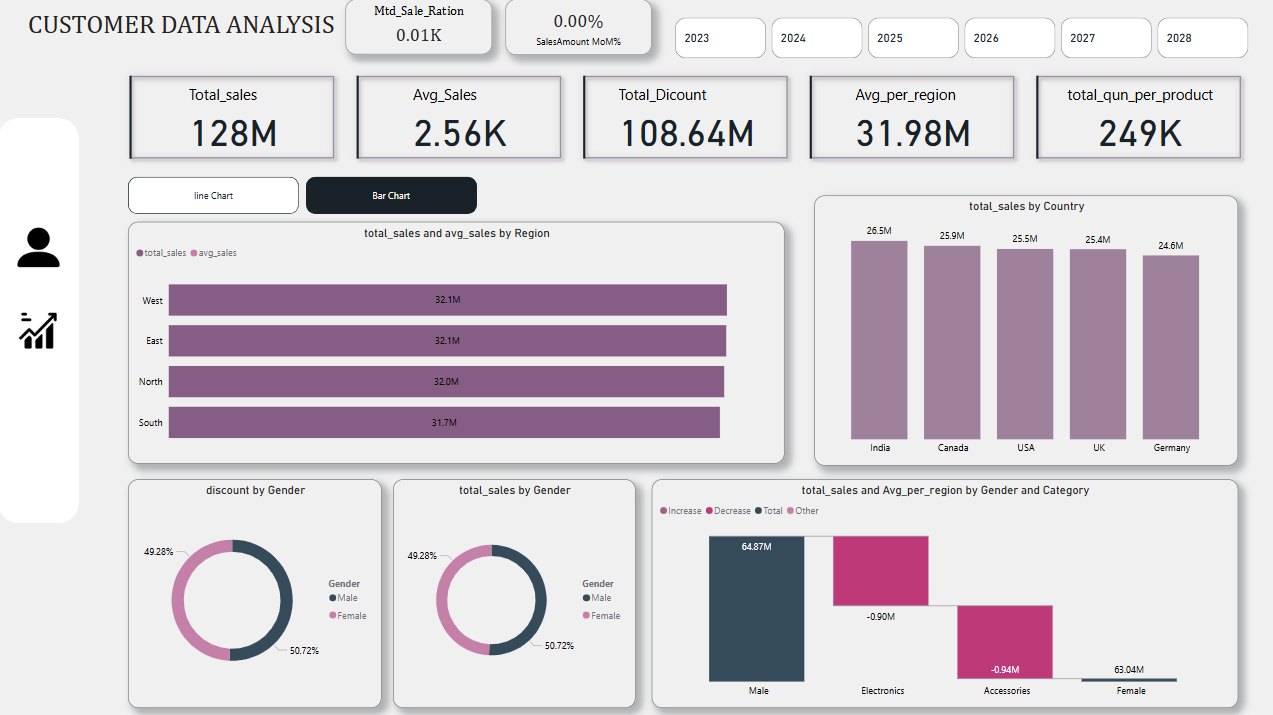
This Power BI dashboard uncovers key trends in sales, discounts, and customer preferences, enabling data-driven decisions for optimized client engagement and revenue growth.
A reporting analyst role focused on generating business insights through data Developed an interactive and dynamic dashboard to enhance data-driven decision-making processes Designed and managed Excel-based reports and dashboards for daily, weekly, and monthly business insights Utilized advanced Excel functions and PivotTables for in-depth data analysis Cleaned and transformed raw data from multiple sources to ensure accuracy and consistency in reporting Generated actionable insights through data summaries, trend analysis, and performance tracking Collaborated with Sales, Finance, and Operations to fulfill custom data requests and reporting needs Created standardized report templates for consistent reporting across the team Ensured data quality by performing routine validation and troubleshooting of Excel models Supported data visualization efforts using Power BI by integrating Excel datasets for more interactive reporting Maintained clear documentation for report structures, formulas, and update processes
Developed and maintained BI dashboards understand real world data to show the valuble insights.
At Hadi Learning Nike and sale Dashboard -Power BI Developer |Excel, Data visualization
Develop interactive and dynamic dashboard to understand the data-driven decision-making process Academic project movies dashboard analysis |Excel, Power BI, DAX, Data visualization
Interested in data analytics collaboration or have a project in mind? I'm always open to discussing new opportunities and challenges.